Traditionally, architectural drawings have been confined to three, familiar formats — plans, sections and elevations have been used to communicate an architect’s vision for centuries. In fact, architectural plans can be traced back more than 4000 years ago, and remain a critical part of the creative process that takes a building from concept to construction.
However, recent years have given rise to new forms of architectural graphics and diagrams that are fast becoming an essential creative weapon in the armory of design firms. Inspired by the extraordinary success of studios like BIG and MVRDV, designers are increasingly harnessing graphics to illustrate their projects, experimenting with different visual styles to create compelling stories and sell their vision.
Graphics can be used to help clients quickly understand the rationale behind a design, as well as forming a powerful marketing asset for real estate firms and developers. Below are five forms of architectural graphics that could help elevate your project representation to the next level and wow your clients in the process.
1. Concept Process Diagrams
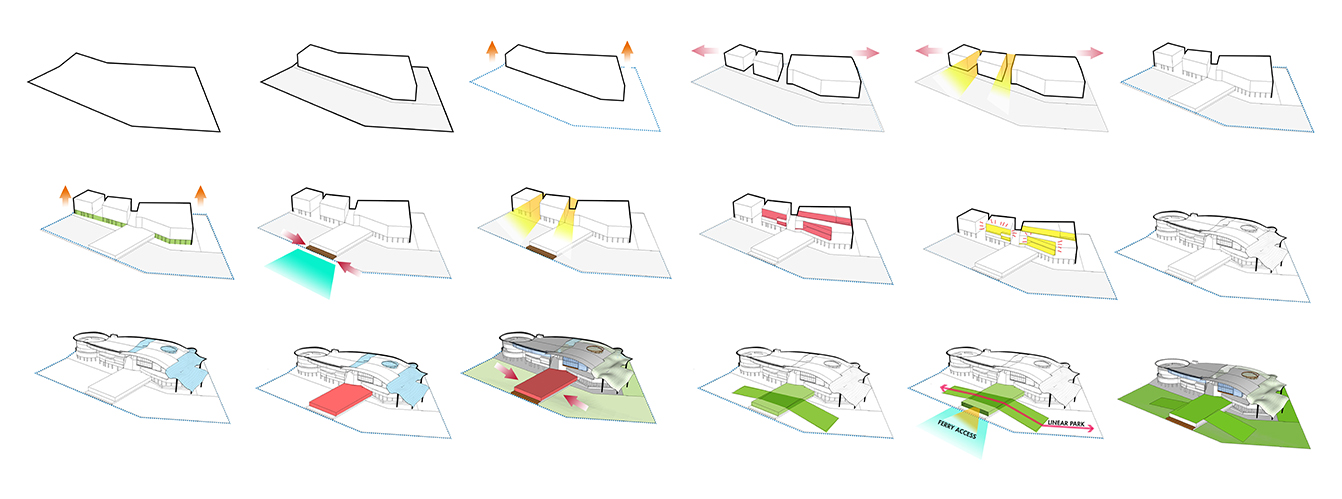
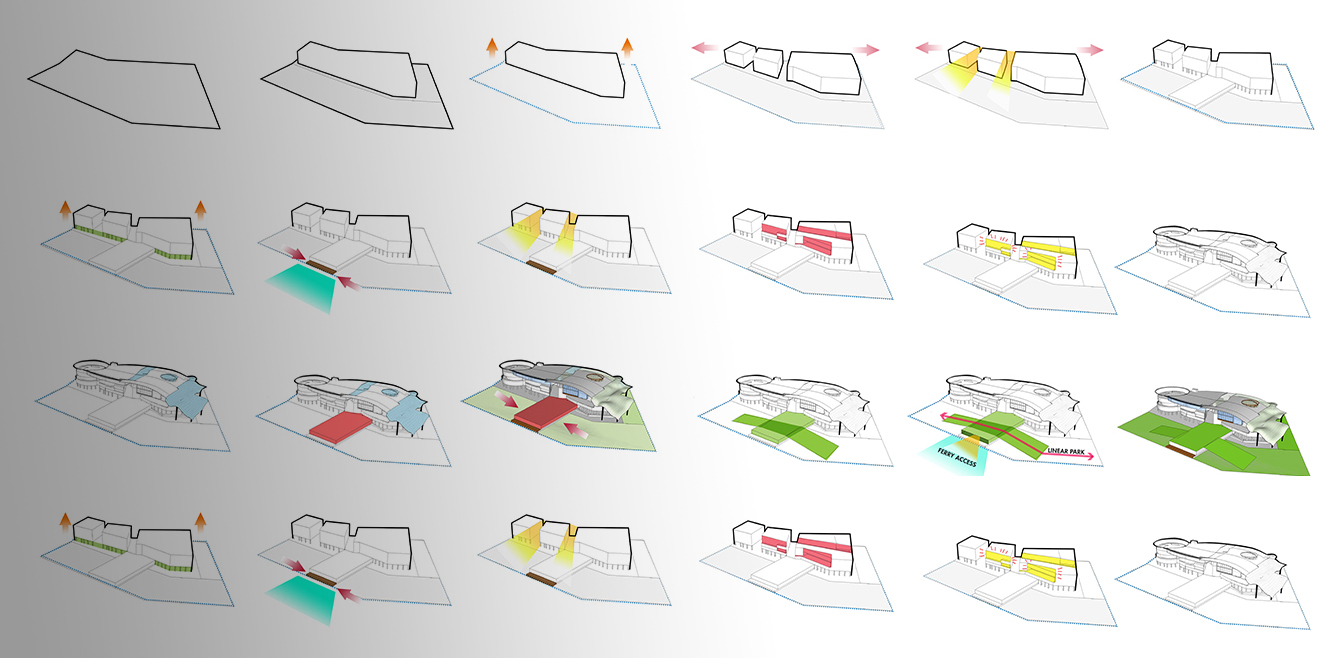
Pioneered by BIG, concept process diagrams are sequences of models that illuminate the logic behind a design. As demonstrated by designer cqmesina above, These models should be kept as simple as possible, with each one highlighting a single factor that contributed to the final form of the proposed building. Common steps include: Sun path (informing the size and location of glazing and decks), prevailing wind direction (informing the location of openings for passive ventilation), greenery (informing the location of public open space and amenities), and views (informing building orientation and outlooks).
2. “X Ray” 3D Floor Plans
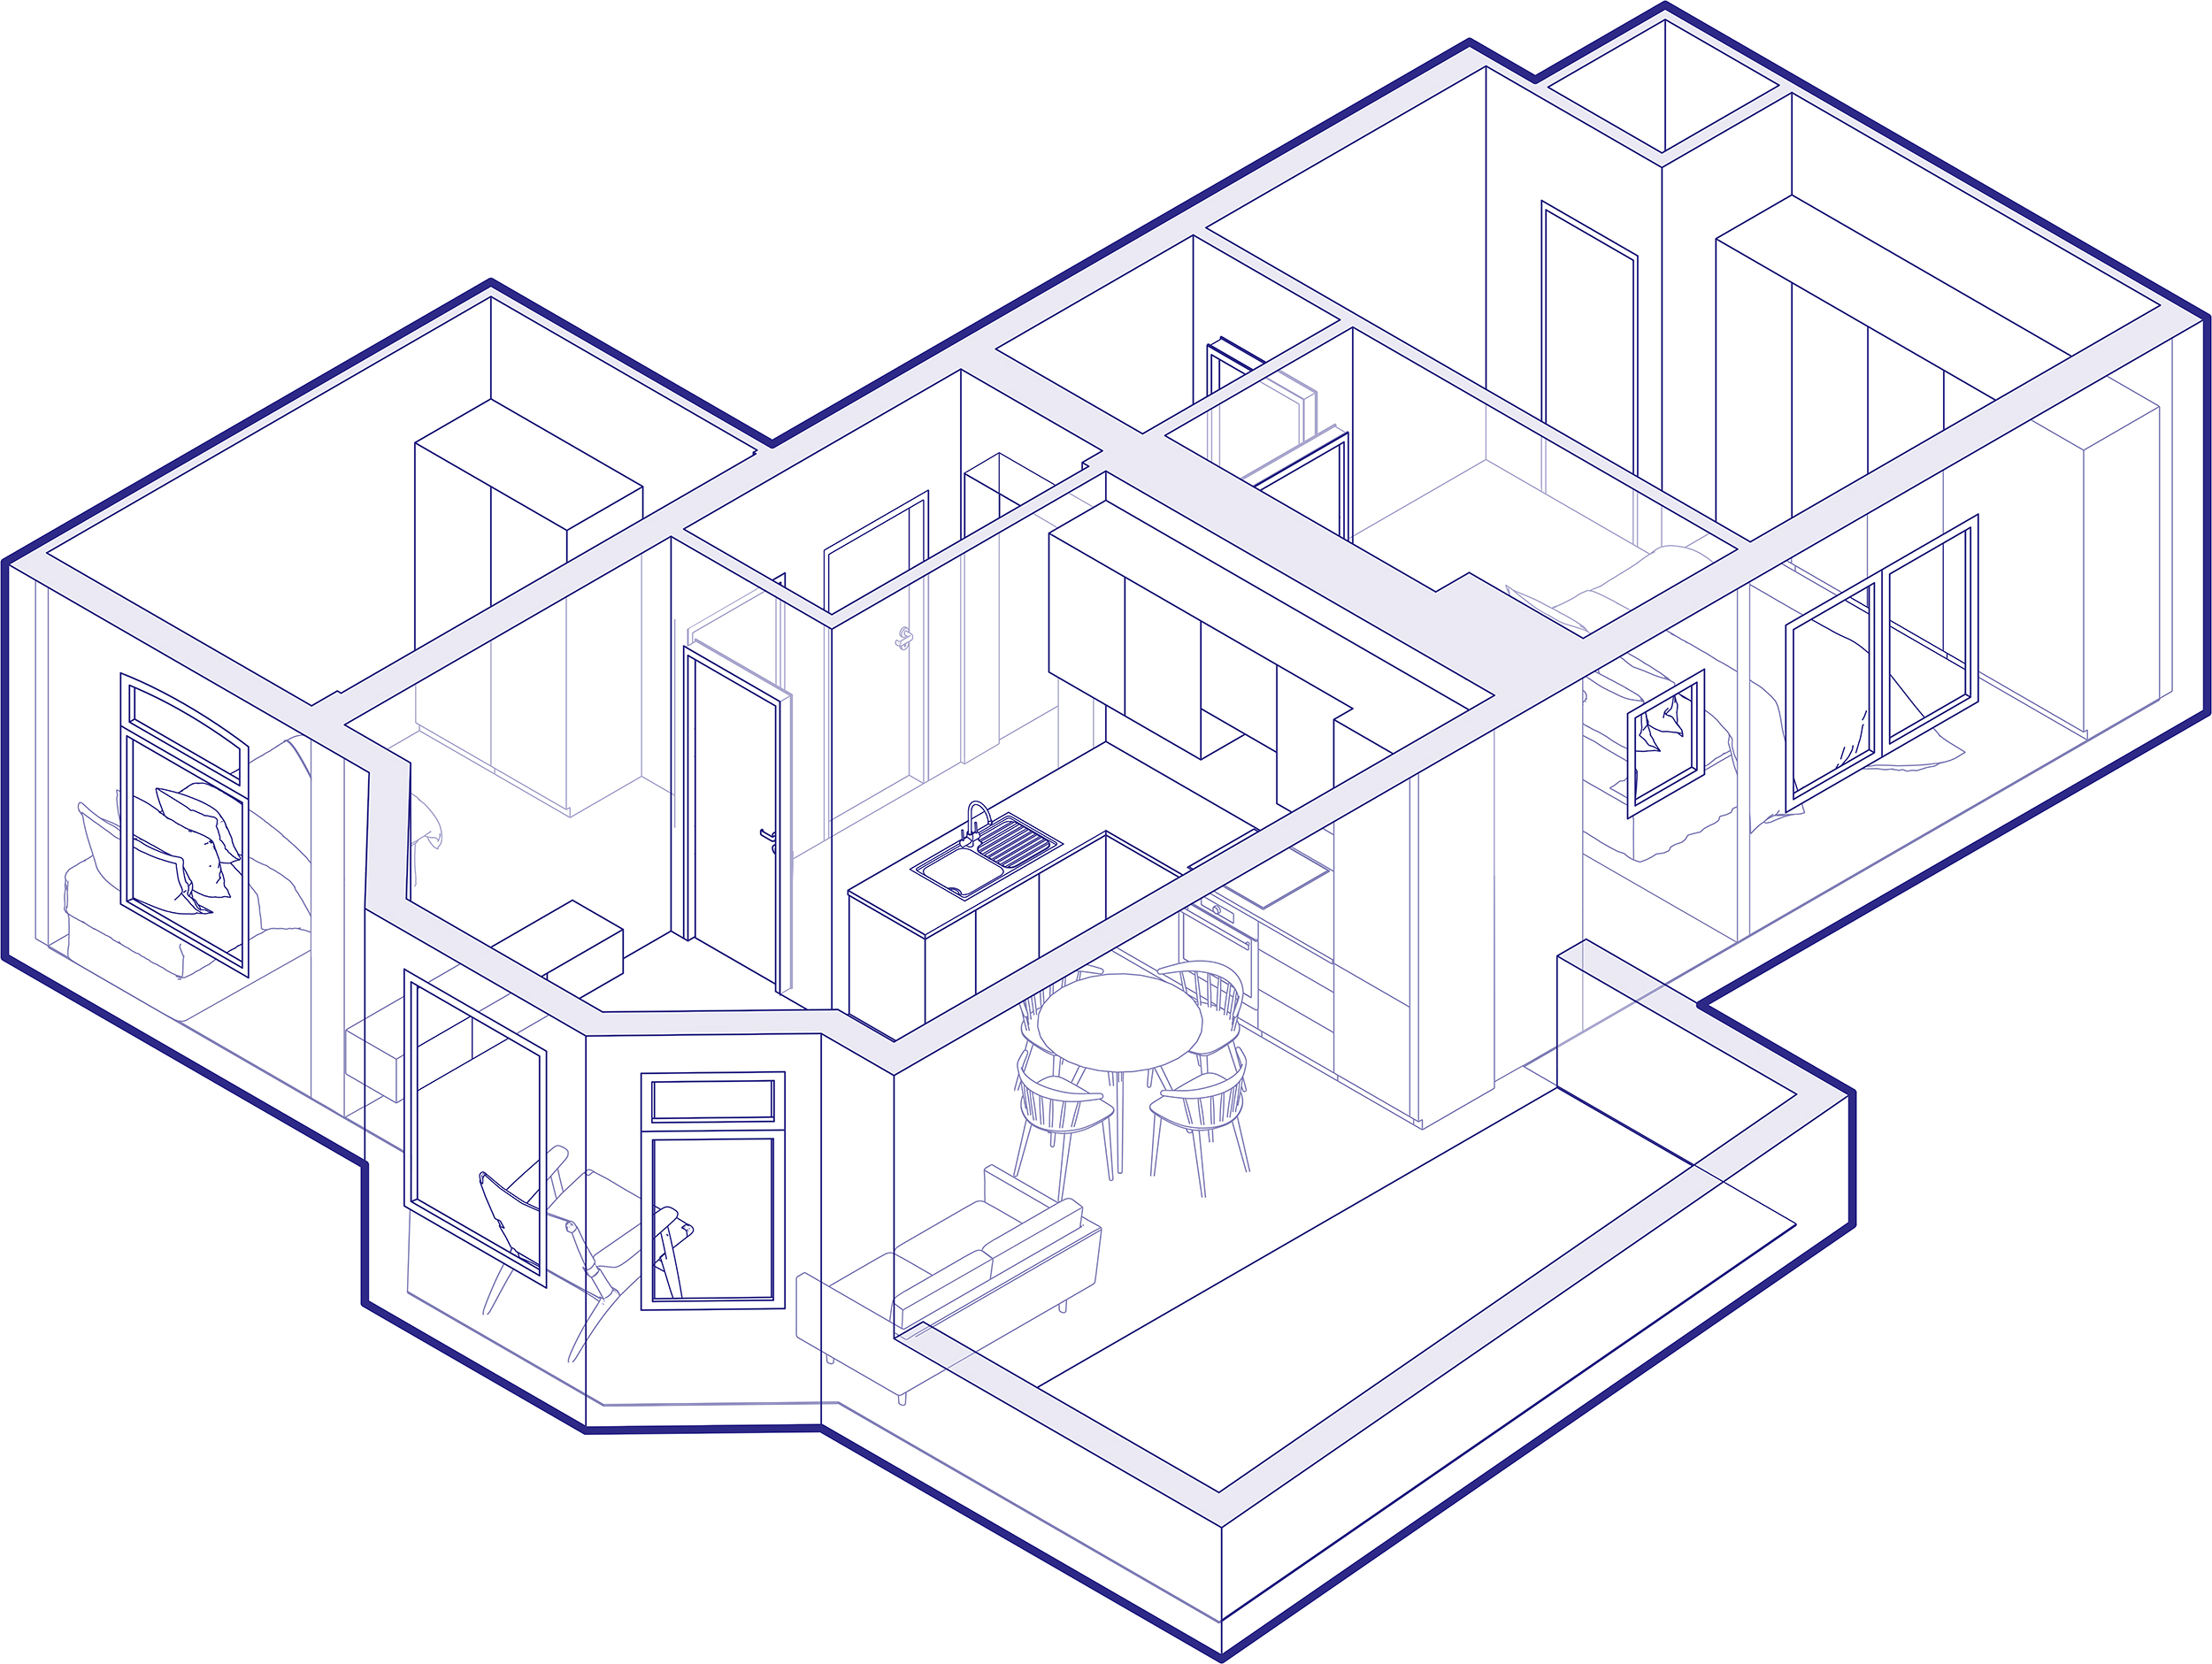
By introducing a degree of transparency to your architectural model, you can communicate the interior layout and the exterior character of a project simultaneously. As illustrated by architectural illustrator martinaantezza in the above model, this method provides a crystal clear view of space that can be understood by clients at a glance. There are various ways to achieve this effect — you can utilize the “x-ray” view style in SketchUp or take a slightly more complex approach (see the work of Alex Hogrefe).
3. Exploded Axonometrics
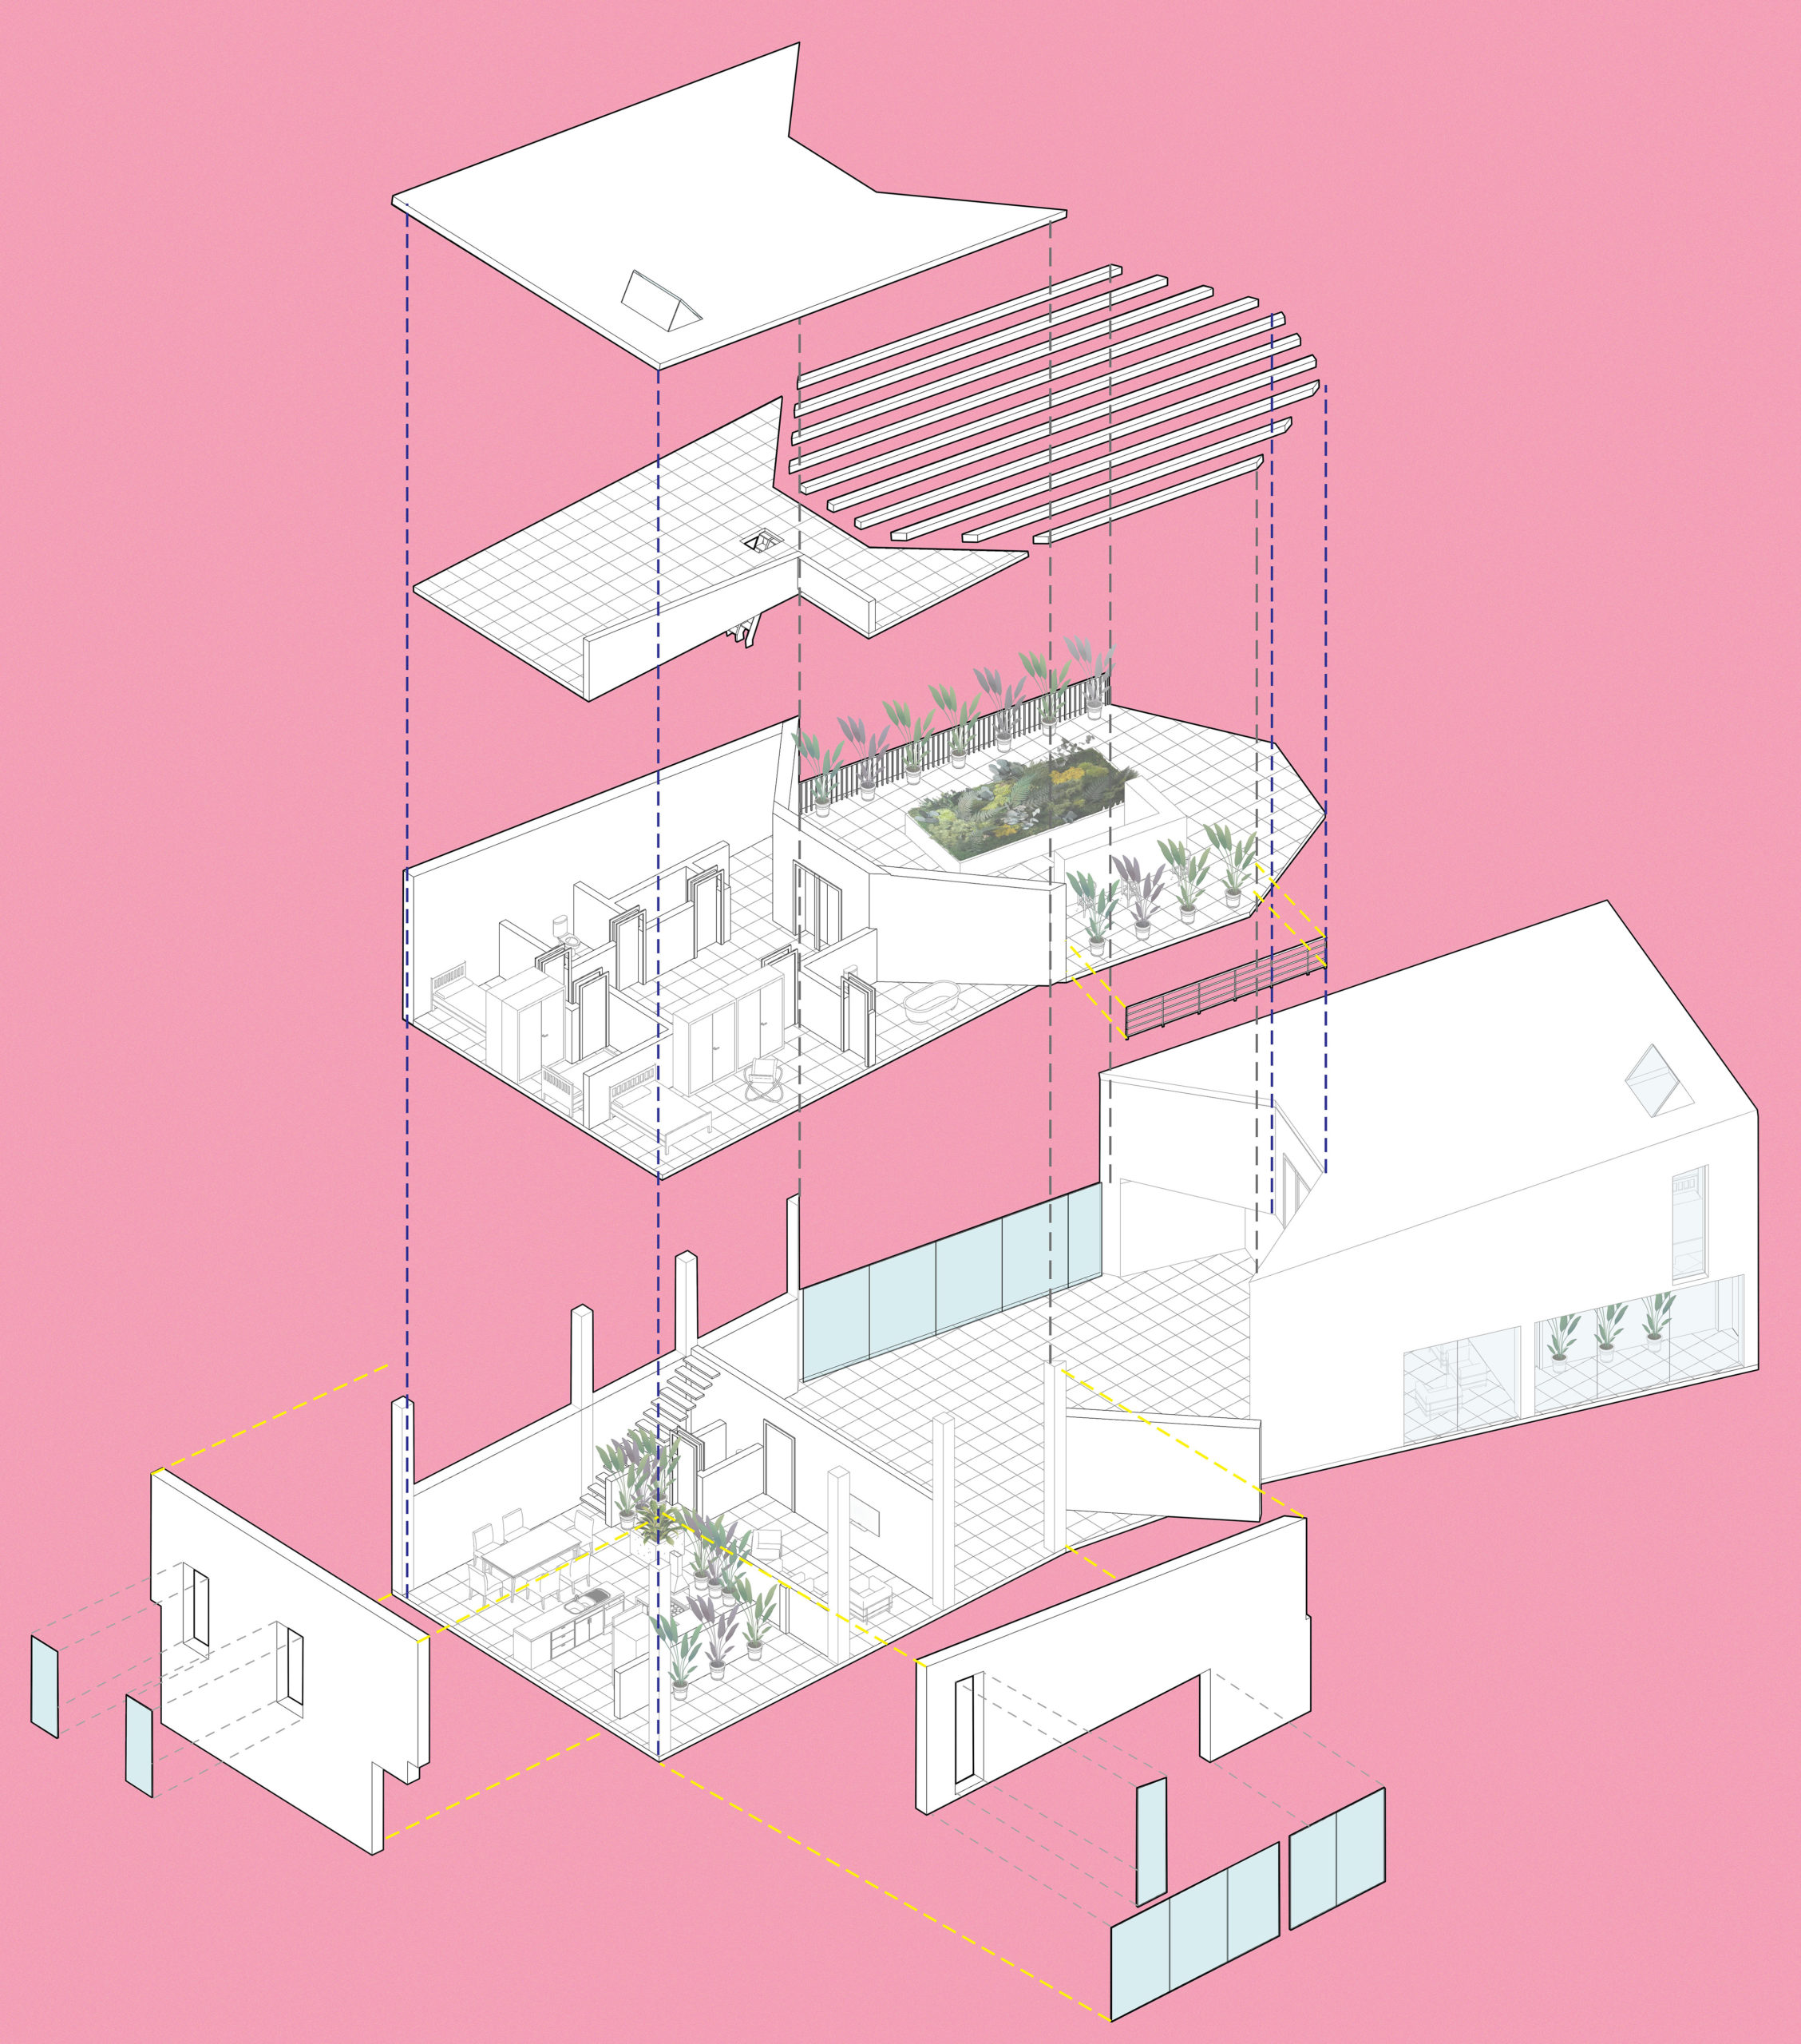
The exploded axonometric is the architectural equivalent of a scientific ‘dissection’, in which a building is pulled apart to reveal each component in isolation. Presenting a diagram like this allows every element of a building to be viewed in minute detail, making it helpful for clients to visualize the materials that their space will be composed of, and for contractors to assess construction logistics. Diagrams like the one above, created by ahmedkita, can be created in any 3D modeling software — just be sure to pull your components apart in a linear fashion (horizontally or vertically) and include dotted assembly lines to maintain clarity.
4. Infographics
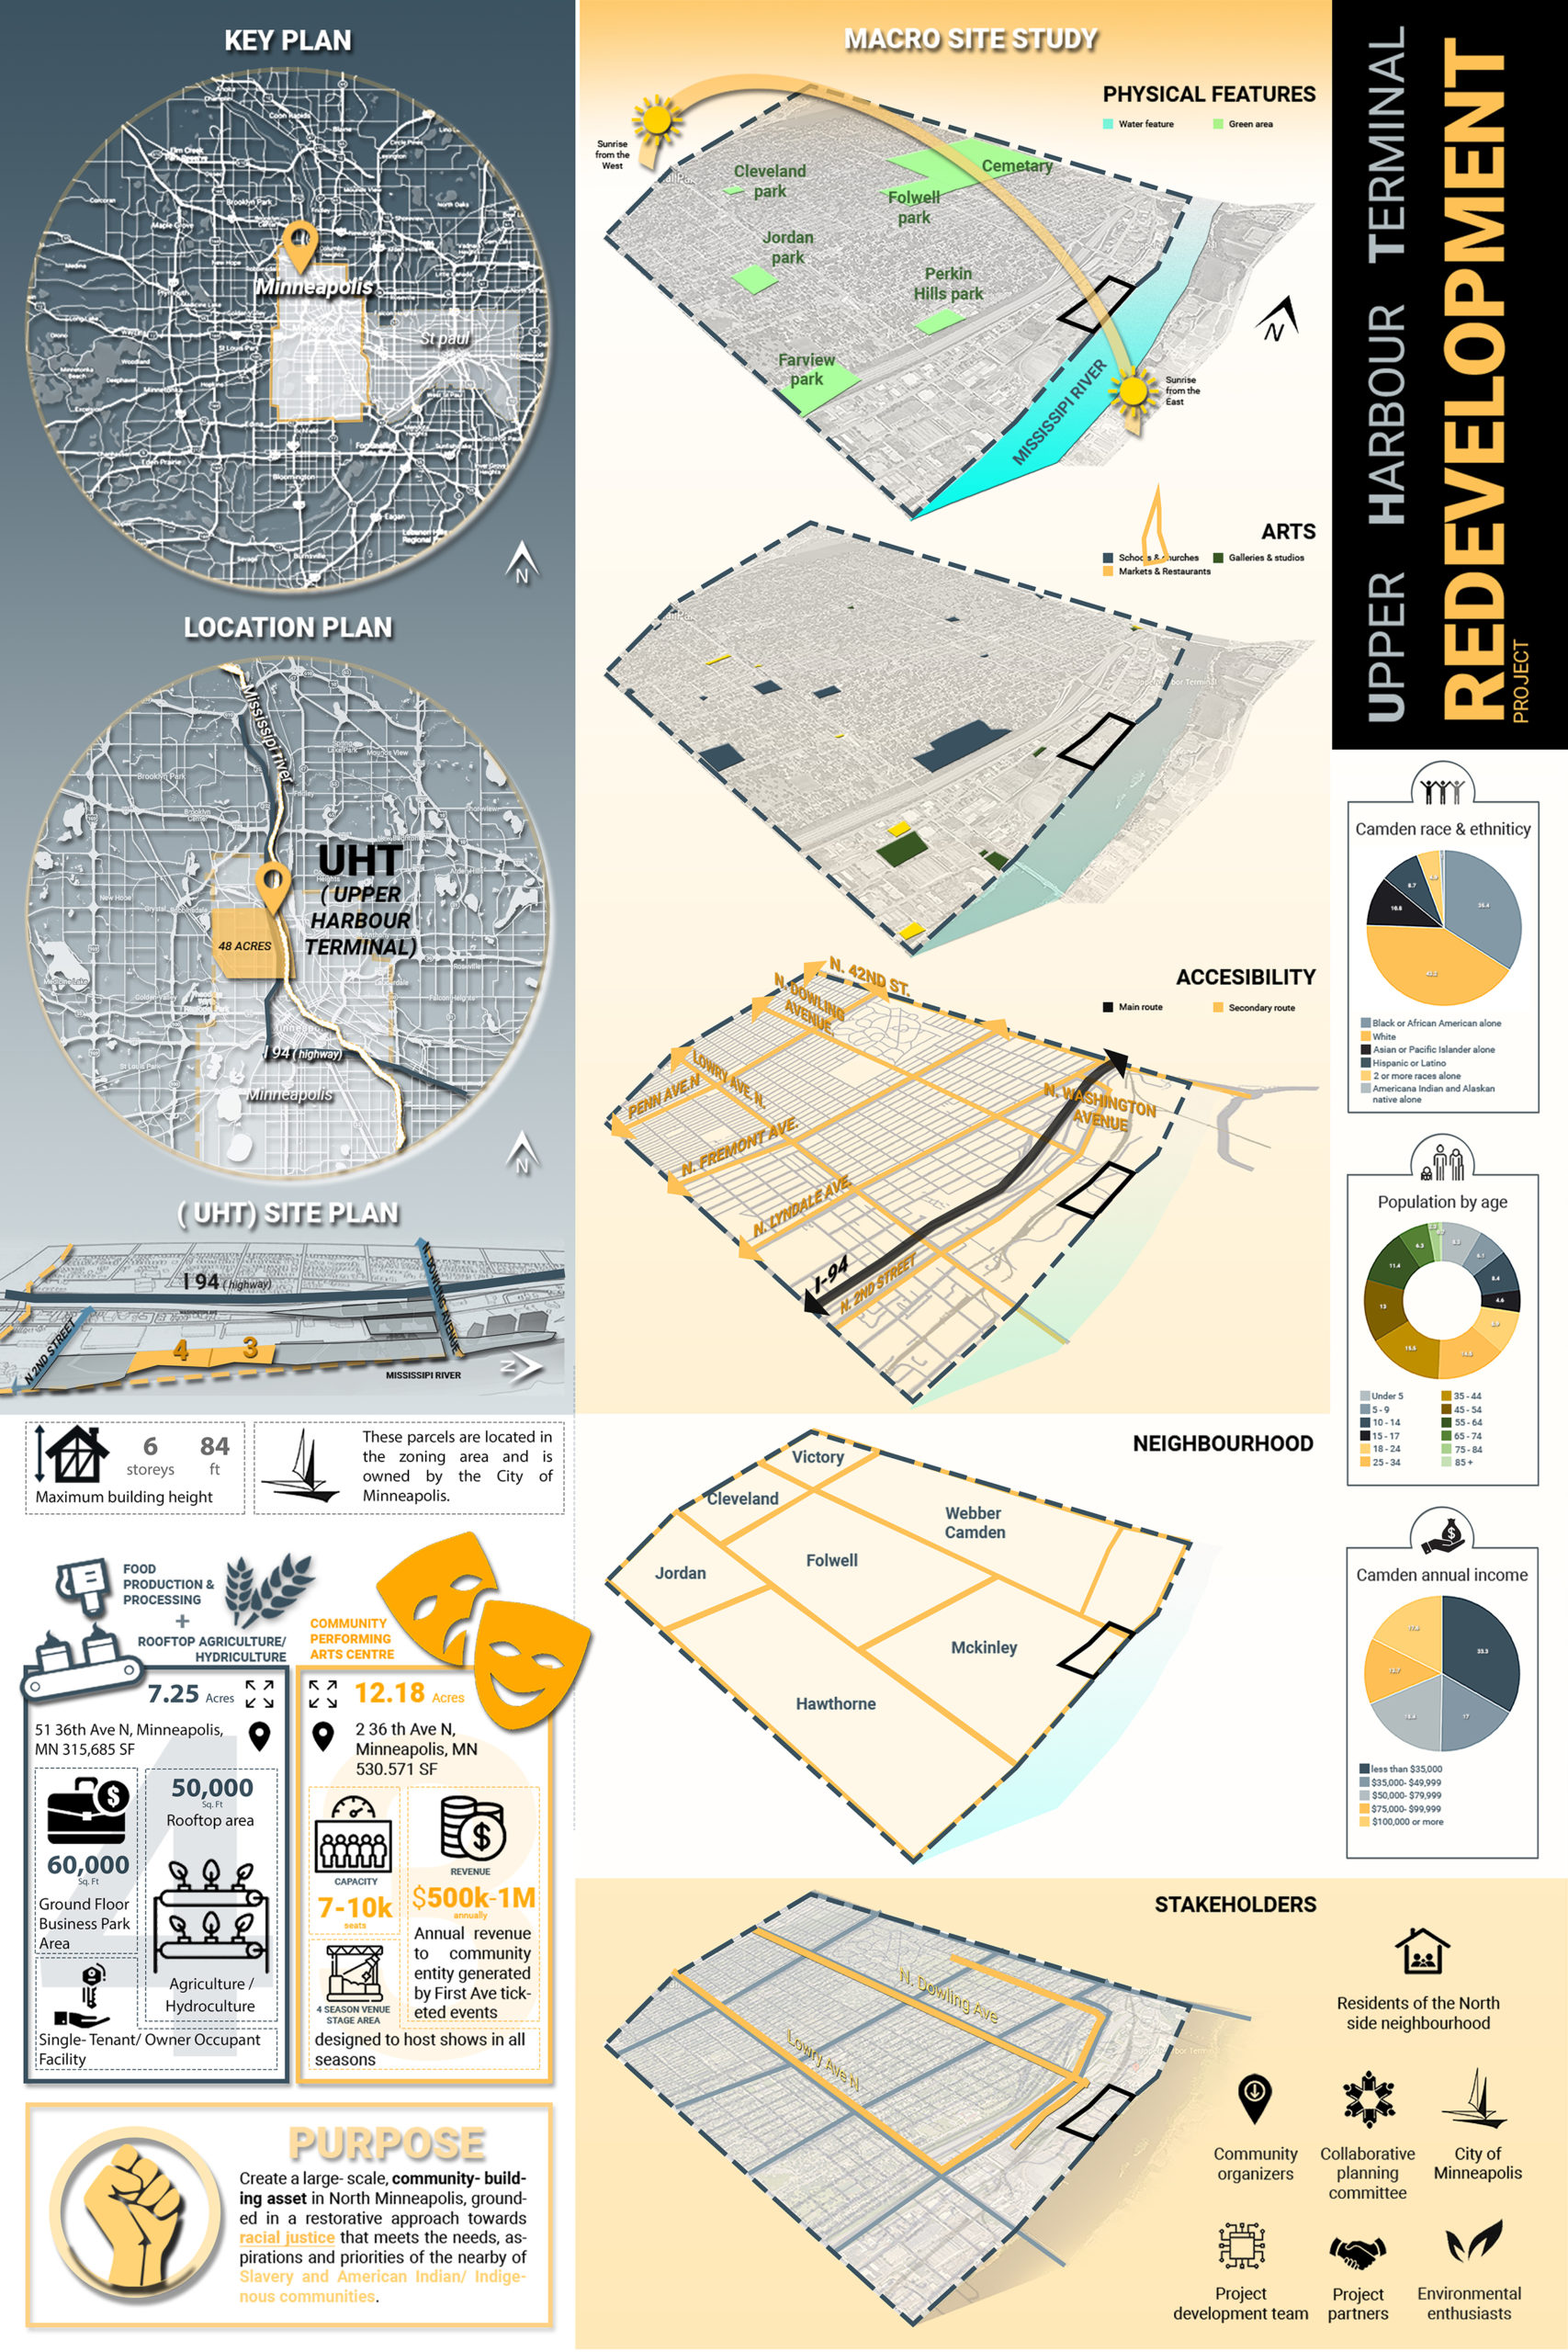
Infographics can be a compelling format when the goal is to persuade multiple stakeholders about your proposal. For example, they can be utilized in public hearings or presentations to city councils, with statistics revealing key demographics, traffic and pedestrian figures, land use percentages and more. When combined with sequential diagrams showing how a proposal was conceived, these statistics can help to justify large scale design solutions. To compose a presentation board like the one above, created by illustrator relativespace12, combine simple views of 3D models, site maps and diagrams with iconography and key statistics in a rational, clean layout.
5. Audio, Surveillance and Lighting Models
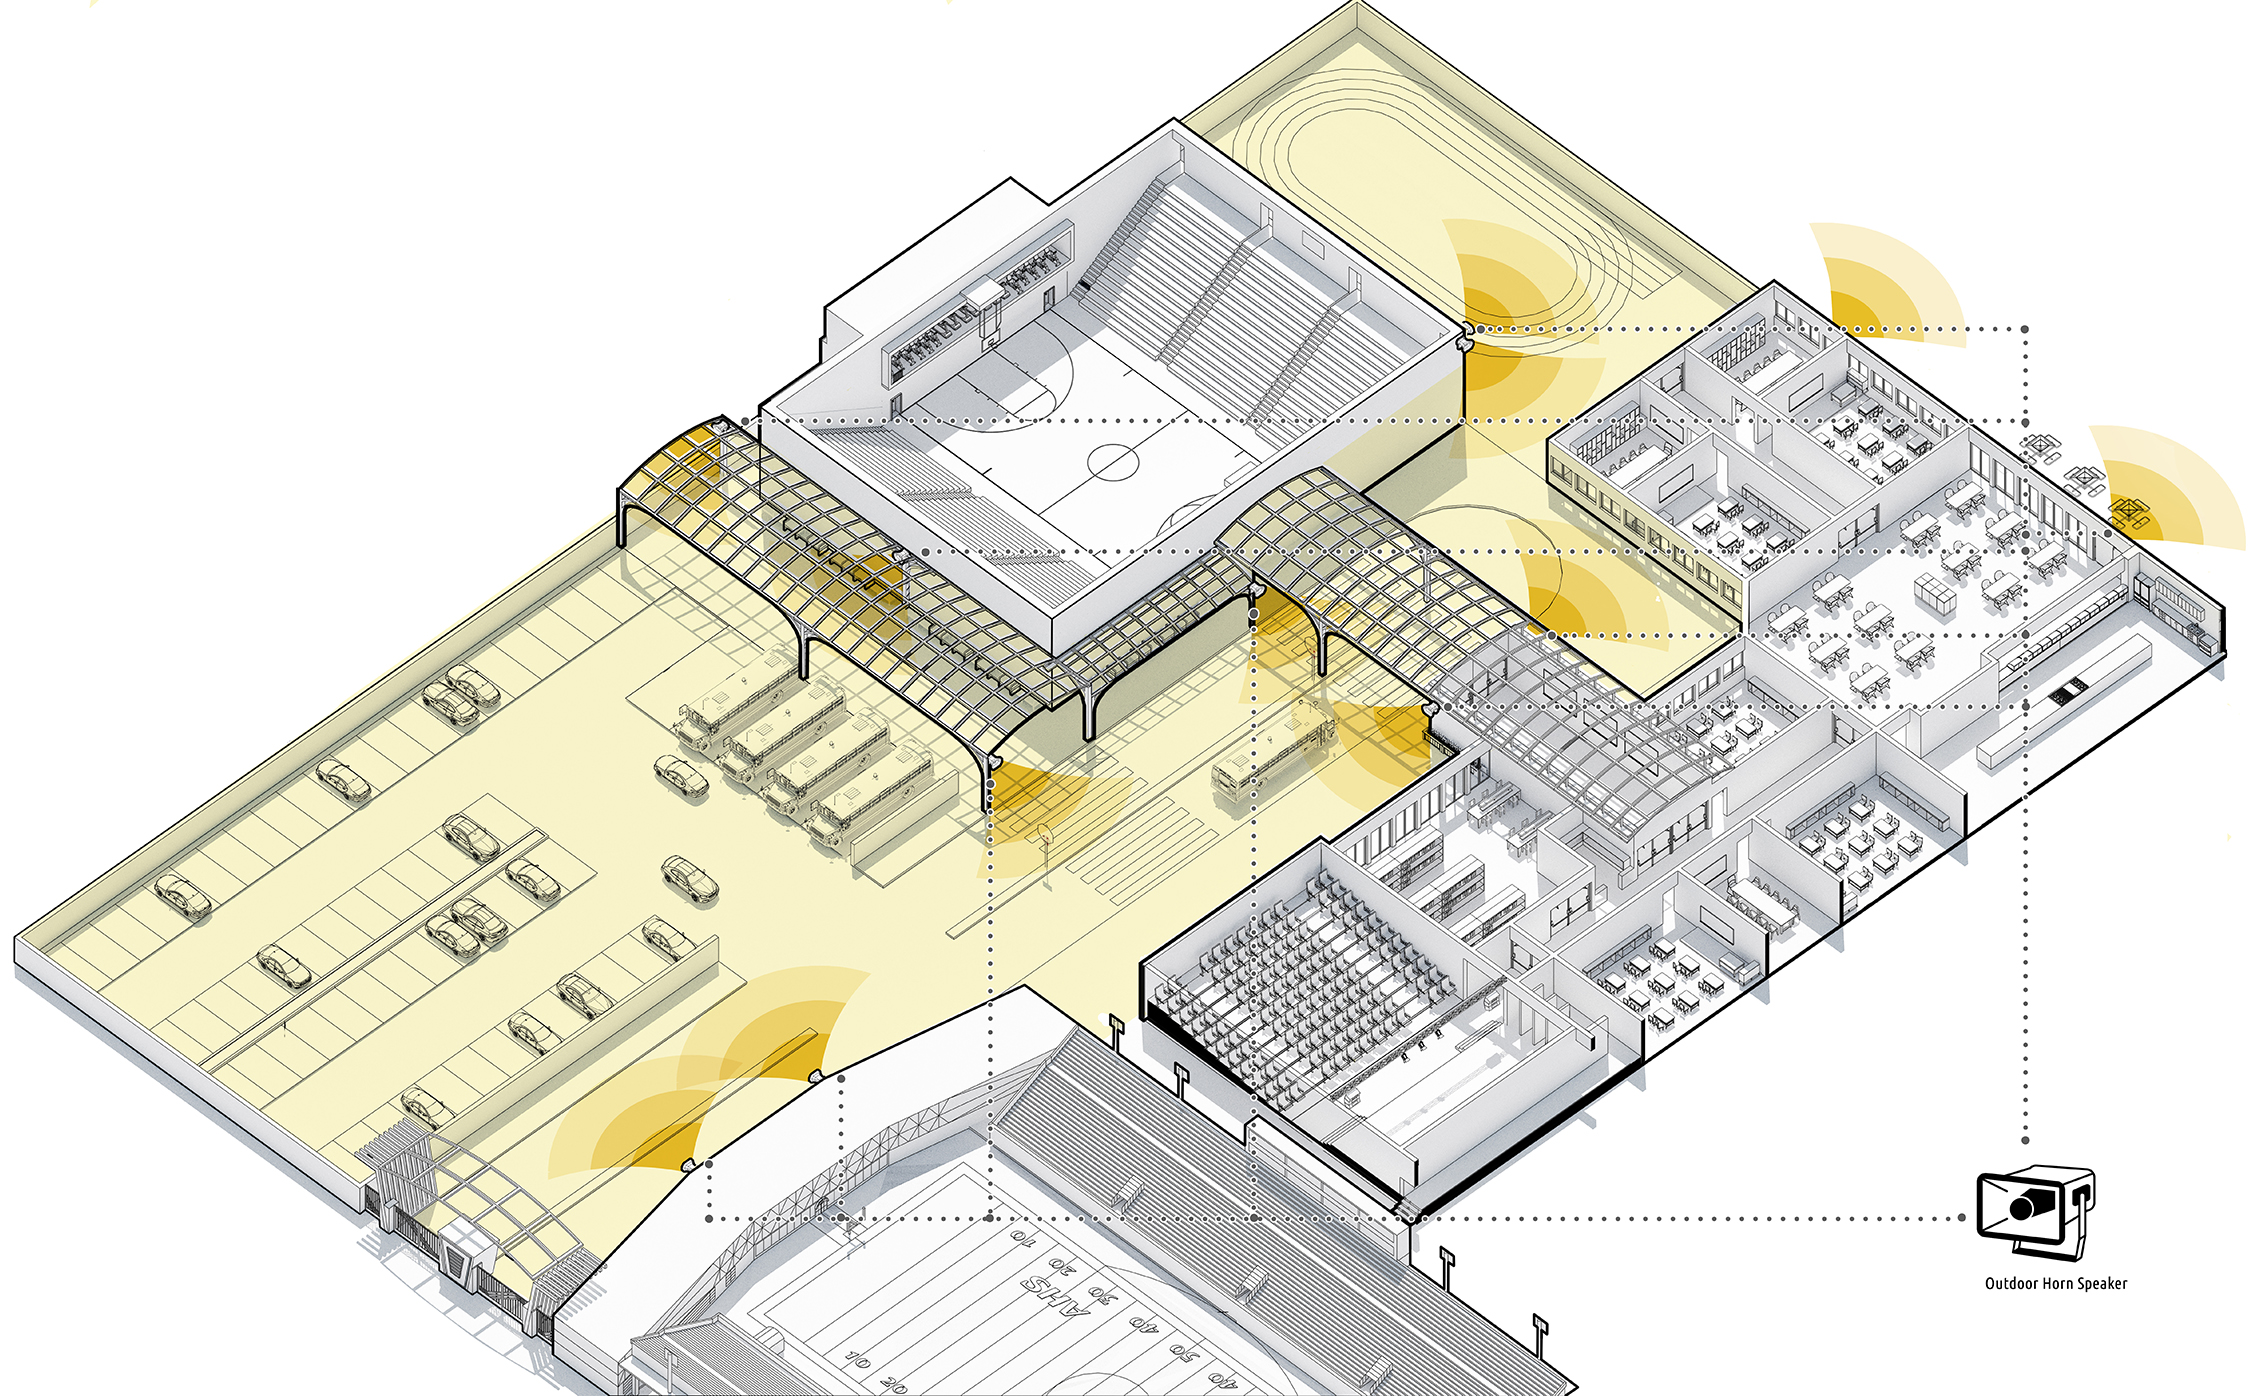
Using simple color coding techniques, a basic 3D model can be used to illustrate the scope or range of audio, visual or illumination devices within a project. The example above highlights the position and orientation of loud speakers within a sporting complex, created by illustrator kavinrao, useful for mapping out proposed surveillance or public announcement systems. The same technique can also be harnessed to illustrate the position and range of security cameras or lighting within a project. Stick with one color and one diagram per system to ensure maximum clarity.
For more creative ideas for architectural graphics and diagrams, check out the work of more than 1,400 freelance professionals on Fiverr’s Architecture & Interior Design Marketplace.
